|
Anatomical Distribution of Subcutaneous Fat and its Relationship with Body Condition Score in Pack Mules from the Central Andean Area of Colombia*
ARTÍCULO DE INVESTIGACIÓN
Juan C Velásquez-Mosquera1, MV, MSc Juan D Corrales-Álvarez2, Zoot, MSc, PhD
* Study related to the research project “Characterization of working mules in panela cane production systems from the west region of Cundinamarca” funded by the Research Vice-Rectory of Universidad de la Salle and Fedepanela. 1 Professor-Researcher, REMEAT group (Reproduction and Improvement in Tropical Animals) 2 Professor-Researcher in the Research group on sustainable animal production, College of Agricultural Sciences, Universidad de la Salle, Carrera 7 179-03, Bogotá, Colombia.
This email address is being protected from spambots. You need JavaScript enabled to view it.
Recibido: 19 julio de 2018, Aprobado: 17 febrero de 2019, actualizado: 15 junio de 2019
DOI: 10.17151/vetzo.2019.13.2.1
SUMMARY. Introduction: In the Colombian Andean mountain areas, mules are the basis for the development of agricultural activities of smallholders. In the management of mules, the empirical knowledge of farmers predominates for the nutritional aspect, which implies having the animals in optimal body condition for the task of pack loading. One of the important aspects of management related to animal welfare is the determination of body condition (level of fatness), which is calculated via subjective (visual) and objective techniques such as real-time ultrasound fat thickness measurement. Aims: The aim of the present study was to determine the fatness using ultrasound in different anatomical regions of the body and its association with body condition scores (BCSs) in working mules. Methods: Mules (n = 43) aged 5–30 years, from four municipalities in the western area of Cundinamarca, were measured in each sample. Mules were assigned a BCS value (1–9) based on visual appraisal and palpation of the dorsal and lumbar areas, area behind the shoulder, withers, and tail head as well as by measuring the subcutaneous fat thickness using ultrasound in five anatomical sites [back fat thickness (BFT), loin fat thickness (LFT), hearth fat thickness (HFT), wither fat thickness (WFT), and hip fat thickness (FHT)]. Results: The mean BCS in the mules was 5.2 ± 1.1 and the mean subcutaneous fat thickness for the sites BFT, LFT, HFT, WFT, and FHT were 5.2 ± 2.1 mm, 3.9 ± 0.8 mm, 7.0 ± 2.2 mm, 4.7 ± 1.5, and 4.2 ± 1.2 mm, respectively. Correlation coefficient between BCS and BFT was r = 0.39 (p <0.01), that between BCS and HFT was 0.49 (p <0.01), and that between BCS and HFT was r = 0.43 (p < 0.01). Conclusion: We concluded that the distribution of subcutaneous fatness is different for the five anatomical sites evaluated, demonstrating a greater fatness in the hearth region followed by the back region.
Key words: fatness, working equids, ultrasound.
Distribución anatómica de la grasa subcutánea y su relación con el puntaje de condición corporal en mulas de carga del área Centro Andina Colombiana
RESUMEN. Introducción: en las zonas andinas de montaña colombiana las mulas son la base para el desarrollo de actividades agrícolas de económicas campesinas. En el manejo de las mulas predomina el conocimiento empírico de los campesinos para el aspecto nutricional, que implican tener animales en condición corporal óptima para el trabajo de carga. Uno de los aspectos importantes de manejo relacionado con el bienestar animal es la determinación de la condición corporal (nivel de engrasamiento), la cual puede ser calculada por medio de técnicas subjetivas (visuales) y objetivas como la medición del espesor de grasa por ultrasonido. Objetivos: El objetivo del estudio fue determinar el engrasamiento en diferentes regiones anatómicas corporales y su relación con el puntaje de condición corporal (PCC) en mulas de trabajo. Métodos: Se midieron mulares con edades entre 5 y 30 años, de 4 municipios del occidente de Cundinamarca (n=42). En cada ejemplar se midió el PCC escala (1-9) de forma visual y el espesor de grasa subcutánea usando ultrasonido en 5 sitios anatómicos (dorsal - EGD, lumbar - EGL, cincha - EGC, cruz - EGCR y anca - EGA). Resultados: El PCC promedio en las mulas fue de 5,2±1,1 y los promedios de espesor de grasa subcutánea encontrados para las regiones EGD, EGL, EGC, EGCR y EGA fueron 5,2±2,1 mm, 3,9±0,8 mm, 7,0±2,2 mm, 4,7±1,5 y 4,2±1,2 mm, respectivamente. Se encontraron correlaciones moderadas entre PCC y EGD (r=0,39; p<0,01), PCC y EGA (0,49; p<0,01), PCC y EGC (r=0,43, p<0,01. Conclusiones: Se concluye que la distribución del engrasamiento subcutáneo es diferente para los 5 sitios anatómicos evaluados, evidenciando un mayor engrasamiento en la región de la cincha seguida por la región dorsal.
Palabras clave: engrasamiento, équidos de trabajo, ultrasonido.
Introduction
Body condition score (BCS) is an essential tool used to monitor the wellbeing and the nutrition of working equids. The need to closely monitor the body condition of working animals has led to a search for tools that facilitate quick and non-invasive estimation of animal fatness (Silva et al 2016).
BCS systems are currently used to assess body fat, although their ability to accurately reflect adiposity in equids has been debated (Argo et al 2014). Despite the simplicity posed by the use of BCS in equids, the ability of untrained operators to accurately assess BCSs remains a cause of concern (Mottet et al 2009). Therefore, tools have been developed that enable accurate and non-invasive estimation of the body composition. Some of the tools that have gained popularity in the previous decade include real-time ultrasound (RTU), which has widely been used in livestock management due to its operative features and has recently been applied to equids (Quaresma et al 2013 and Superchi et al 2014). Although RTU is not used in working equids on a routine basis, it has been proven to be advantageous in several countries: it offers adequate spatial resolution, is well accepted, and can be easily performed on an animal standing up within countryside conditions (Quaresma et al 2013).
Several reports have used BCS to assess fatness in horses (Silva et al 2016, Martin-Giménez et al 2016). Besides the visual traditional method, other studies performed with horses and donkeys have used RTU to assess animal fatness (Quaresma et al 2013; Velásquez et al 2016). The animal fatness was assessed to discover the possible associations between their performance in a specific activity and optimal nutritional management or, in other cases, to determine the relationship between equid’s body condition and their wellbeing. Moderate-to-high correlations have been reported between the methods used to evaluate fatness in horses (Gee et al 2011, Velásquez et al 2016) and donkeys (Quaresma et al 2013). In studies performed by Gee et al (2003), subcutaneous fat measurements performed by ultrasound on the hips of sport horses were correlated with the BCS value (p = 0.001) and accounted for the 71% of the variation observed in the carcass weight (p = 0.002).
A few reports that performed post-mortem evaluations in different types of equids found differences in the subcutaneous fatness distribution of the carcass weight (Fabregas & Such, 1998). These studies attribute the differences observed among species to factors related to the animal weight, its sex, and the age at which the animal was slaughtered; however, typically, a higher level of subcutaneous and abdominal fat was observed in the carcass weight of horses, whereas a higher level of hip and flank fat was found in the carcass weight of donkeys. Mules presented higher levels of abdominal fat than horses (Fabregas and Such, 1998).
Research regarding fatness estimations performed in Colombian mules through subjective or objective techniques is lacking, and studies on these equids with regard to their nutritional management and wellbeing, among other topics, are scarce. Therefore, an exploratory study was proposed to elucidate the fatness distribution in pack mules via objective and subjective methods in an important panela production region located in the Central Andean region of Colombia.
Materials and Methods
Location and samples
Panela producers and mule owners from Gualivá Province in Cundinamarca, in the Central Andean region of Colombia, participated in the present study. The Gualivá Province is characterized by the development of commercial mountain agriculture between 1000 and 1800 m above sea level, with a coffee production region being located between 1200 and 1800 m above sea level and a panela cane production region being located between 1000 and 1500 m above sea level (DANE, 2015).
To develop the exploratory study, different districts and municipalities of the Gualivá where health brigades have been developed were visited, and a group of animals was selected to evaluate their body condition level via objective and subjective methods. A total of 43 pack mules were enrolled from the municipalities of Villeta, Utica, Nimaima, and Vergara. Animal age was determined using dental chronometry and it ranged from 5 to 30 years.
Nutritional management
Each owner was questioned regarding the nutritional management of their animals. In most cases, the mules shared a similar diet (Table 1) consisting of grazing on grasses (Brachiaria decumbens), supplemented by cut forage (Panicum máximum) and melote, a subproduct of panela cane production that has a compact and dark appearance and a sweet taste (obtained from cachaça dehydration during milling and used as an animal diet supplement) (Fedepanela, 2010).
Table 1. Type and level of supplementation in working mules
Measurements
An Aquila Vet ultrasound scanner (transducer with a 3.5 MHz frequency and an 18-cm probe) was used. Images were recorded and interpreted using the ODT software (optical data transfer).
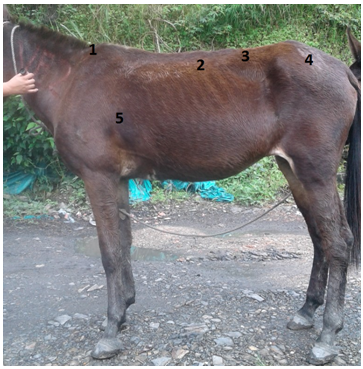
The subcutaneous muscle and fat measurements via ultrasound in mules were obtained as follows: The loin eye area (LEA) was evaluated in square centimeters and the thickness of subcutaneous fat was evaluated in five anatomical sites and expressed in millimeters. The five anatomical sites were adapted according to the methodology used by Quaresma et al (2013) to measure fat in donkeys using ultrasound (Figures 1 and 2):
1. Wither fat thickness (WFT), costal area: the probe was placed perpendicular to the withers. 2. Back fat thickness (BFT), back region: the probe was placed perpendicular to the spine, in the upper portion of the penultimate intercostal space. LEA was measured in that same place. 3. Loin fat thickness (LFT), loin region: the probe was placed longitudinally, 2 cm beneath the lumbar vertebrae and above the flank. 4. Hip fat thickness (FHT), hip region: the probe was placed longitudinally and parallel to the spine, at the hip region, between the os coxae and ischium. 5. Hearth fat thickness (HFT), hearth region: The probe was placed longitudinally, at the abdominal cavity level, in the lateral portion of the hearth, between the intercostal spaces 6 and 7.
Figure 1. Sites used to measure fatness in mules through ultrasound
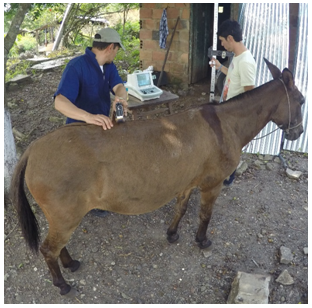
Figure 2. Site of screening on the back region in mules
Weight was estimated using hypometric measurements, and BCS was performed using the subjective visual and tactile scale of body condition suggested by Henneke et al (1983), ranging from 1 to 9 (where 1 is too thin, 4 and 5 are acceptable, and 9 is obese); this scale evaluates 6 sites of the animal’s body: neck, withers, ribs, loin, behind the shoulders, and tail head. In all animals, BCS was estimated by the same technician, who was trained in performing RTU technique.
Statistical analysis
The analysis included descriptive statistics. Furthermore, a multiple correlation analysis was performed between the measurements obtained using ultrasound and the BCS using Statgraphics Centurion XVII software.
Results and Discussion
The mean values for weight, BCS, subcutaneous fat thickness, LEA, and fatness are presented in Table 2.
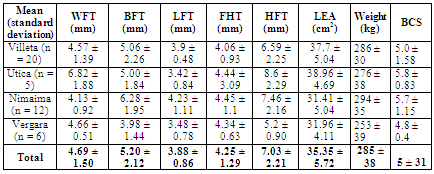
Table 2. Mean fatness values obtained via the visual technique and using ultrasound in mules
Abbreviations: BFT, Back fat thickness; LFT, Loin fat thickness; HFT, Hearth fat thickness; WFT, Wither fat thickness; FHT, Hip fat thickness; LEA, Loin eye area; BCS, Body condition score
Weight The mean weight of mules in the area ranged from 253 to 294 kg; these values were associated with medium-small sized mules, which are the type of animals typically used for packing activities in mountain slope areas.
Loin eye area Although measuring LEA was not the main purpose of the study, this value was estimated, and it reflected some differences in the muscle conformation of animals—the conformation was higher in mules from Villeta and Utica compared with those from other areas. These values depend on the type and the parents involved in the dihybrid cross.
Fatness estimation using the body condition score
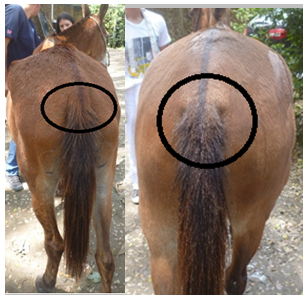
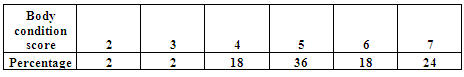
BCS was based on the Henneke (1985) scale, which is scored via visual appraisal and palpation of the covering fat in several anatomical areas of the medium and posterior third of the animal. This determination yielded acceptable mean values (Figure 3). According to this technique, an optimal BCS value ranges from 5 to 7 depending on each equid, because it varies depending on the animal’s breed and purpose; accordingly, thin scores are acceptable for sport horses and higher scores are acceptable for horses for other purposes, such as riding and packing. In other equids, such as mules, studies reporting the optimal BCSs according to different purposes are lacking.
In the present study, 54% of the mules evaluated demonstrated scores from 5 to 6, which are considered as optimal values; 24% of mules demonstrated values beyond this optimal score and 22% demonstrated values below it (Table 3). However, owners reported that, regardless of their fatness, all animals performed well in activities related to the packing and transport of harvest and supplies.
Figure 3. Anatomical site around the tail evaluated to measure body condition
The mean BCS value (Table 2) was similar to the values reported by González et al (2013), Quaresma et al (2013), and Silva et al (2016) for horses and donkeys, respectively, and was higher than the values reported by Pritchard et al (2005), who described deficient body conditions among working equids (mules, donkeys and horses) in India, Egypt, Pakistan, and Jordan, where 70% of the equids exhibited a BCS of <3.
Table 3. Frequency of distribution of the body condition score in mules
Fatness estimation using real-time ultrasound
From the five evaluated sites, the highest thickness of subcutaneous fatness was observed at the hearth and back regions; this could be attributed to the animal’s productive purpose because these are the two sites that have the most contact with the farming tools and packsaddles, thereby being the sites that bear the load and require a higher fat covering. The higher abdominal fatness observed in our study is consistent with the findings reported by Fabregas and Such, (1998), who described high fatness in the carcass weight of mules from Spain. Moreover, a significant correlation was observed between body weight and BFT (Table 3). Other anatomical areas with lower contact and load support can have lower subcutaneous fat deposits. However, estimation of subcutaneous fat in low accumulation anatomical areas using RTU is challenging, because it is not feasible for the ultrasound technician to identify small variations in subcutaneous fat thickness. Furthermore, it has been suggested that the estimations of fat thickness performed using RTU would be more accurate in heavier animals, animals with higher body fat reserves, and adult animals (Sttoufer et al 2004) owing to the lesser number of errors associated with an over- or underestimation of fat measurements obtained using ultrasound. Upon evaluating horses, Kane et al (1987) concluded that the estimation of subcutaneous fat thickness using ultrasound could be incorrectly correlated with body fat when the areas of lower fat accumulation are measured owing to the difficulty in obtaining accurate measurements for such areas. In the present study, the 3.5 MHz transducer and the ODT software used for image interpretation produced images of acceptable quality that could be visualized to perform fat thickness measurements.
Although the values of body fatness obtained could not be compared with the literature reports on mules, it is possible to use RTU for some comparisons with studies performed on equids and donkeys, which are the parent species of mule hybrids.
BFT and WFT values observed in mules were similar to the values reported for equids/donkeys by González et al (2013) and Quaresma et al (2013), higher than the BFT values reported for sport horses by Velásquez-Mosquera et al (2016), and lower than the values reported for horses and donkeys by Silva et al (2016) and for working cow horses by Martin-Giménez (2016). HFT values were similar to the ones reported for donkeys by Quaresma et al (2013).
FHT values were lower than those reported for working cow horses by Martin-Giménez (2016); this type of equid is considered to accumulate higher levels of fat to develop traction energy in the posterior chain.
Correlation between the methods used to estimate fatness in mules
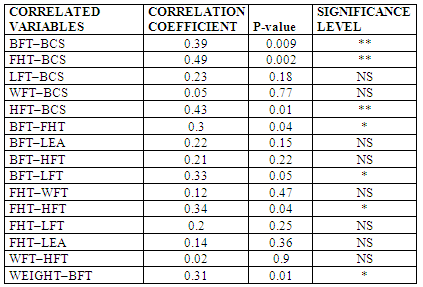
The ultrasound measurements of fat thickness that showed the highest correlation with the subjective BCS measurement were BFT, FHT, and HFT. Within ultrasound measurements, a significant correlation was observed between the following measurements: BFT and FHT, BFT and LFT, and FHT and HFT. No correlation was observed between other measurements such as LFT and WFT (Table 4).
Correlations were observed between the BCS measurements and FHT determined using ultrasound, which were similar to the ones reported by Gee et al (2003) and González et al (2013) in equids.
Table 4. Correlation between fatness measurements in mules
* Significant (p < 0.01) ** Highly significant (p < 0.05) NS Not significant Abbreviations: BFT, Back fat thickness; LFT, Loin fat thickness; HFT, Hearth fat thickness; WFT, Wither fat thickness; FHT, Hip fat thickness; LEA, Loin eye area; BCS, Body condition score
Table 4 proves the correlations between the values for subcutaneous fat thickness measured using ultrasound and BCS assigned to each animal, with three anatomical sites demonstrating a high degree of significance: BFT, FHT, and HFT.
Conclusions
RTU proved to be an accurate tool for the determination of subcutaneous fat thickness in different anatomical sites of mules. Subcutaneous fat distribution differed in the five anatomical sites evaluated, showing a higher level of fatness in the hearth region of the evaluated animals, followed by the back region.
The correlations observed between some ultrasound measurements and BCS suggest that both methods can be used to measure reserve fat in working mules. Based on the correlation coefficients observed between BCS and the ultrasound BFT, FHT, and HFT measurements, these anatomical sites could be considered as visual reference points to define subcutaneous fat level in mules. Other anatomical sites of subcutaneous fat measured using RTU were not useful in the quantification of body fatness in working mules.
Acknowledgements
We thank Universidad de la Salle for the financial support as well as the Fedepanela organization. We are grateful to every owner and handler of mules who were invited and participated in the meetings conducted in the municipalities of Gualivá Province, Cundinamarca, Colombia.
Bibliography
Argo CM, Dugdale AHA, Curtis GC, Morrison PK. Evaluating body composition in living horses: where are we up to? In: Maltin CA, Craigie C, Bunger L, editors. Farm animal imaging. Copenhagen, Ingliston: Quality Meat Scotland; 2014. pp. 12–7.
DANE (2015). Consultado diciembre 2018 Link
Fabregas, X. ,y X. Such (1998) Clasificación de canales equinas: II.- Factores de variación de las características de calidad de la canal. Recuperado Link
FAO/Brooke (2011).The role, impact and welfare of working (traction and transport) animals. Electronic Consultation Report Link
FEDEPANELA Federación Nacional de productores de panela. (2010) Aprovechamiento de subproductos de la caña panelera en la Alimentación animal. Link
Gee EK, PF Fennessy, PCH Morel, ND Grace, EC Firth & TD Mogg (2003) Chemical body composition of 20 Thoroughbred foals at 160 days of age, and preliminary investigation of techniques used to predict body fatness, New Zealand Veterinary Journal, 51:3, 125-131, DOI: 10.1080/00480169.2003.36351. Published online: 22 Feb 2011 Link
Martin-Gimenez T, Aguirre-Pascasio CN, de Blas I. Ultrasonographic Assessment of Regional Fat Distribution and Its Relationship With Body Condition in an Easy Keeper Horse Breed. Journal of Equine Veterinary Science. 2016; 39: 69–75. https://doi.org/10.1016/j.jevs.2016.01.010 Link
Gonzales, F. (17 de mayo de 2013). Determinación de las principales zonas de acúmulo graso subcutáneo en el caballo raza pura chilena y su relación con la condición corporal. Tesis Universidad austral Chile. Recuperado Link
Henneke DR, Potter GD, Kreider JL, Yeates BF. Relationship between condition score, physical measurements and body fat percentage in mares, Equine Vet J 1983; 15: 371-372. https://doi.org/10.1111/j.2042-3306.1983.tb01826.x
Kane RA, Fisher M, Parrett D, Lawrence LM. Estimating fatness in horses. In: Proceedings of the 10th equine nutrition and physiology symposium. Urbana; 1987. p. 127–31. Recuperado Link
Pearson, R. Anne and Ouassat, M. 2000. A Guide to Body Condition Scoring and Live Weight Estimation of Donkeys. Centre for Tropical Veterinary Medicine, University of Edinburgh, page 21.Recuperado Link
Quaresma Miguel Nuno Pinheiro, Rita Payan Carreira, Severiano Silva. Relationship between ultrasound measurements of body fat reserves and body condition score in female donkeys. Article (PDF) Available The Veterinary Journal 197(2):329-334 • February 2013 https://doi.org/10.1016/j.tvjl.2012.12.031 Link
Mottet R, Onan G, Hiney K. Revisiting the Henneke body condition scoring system: 25 years later. J Equine Vet Sci. 2009; 29: 417–8. Recuperado Link
Pritchard JC, Lindberg AC, Main DC, W hay HR (2005). Assessment of the welfare of working horses, mules and donkeys, using health and behavior parameters. Prev. Vet. Med. 69: 265 - 283 https://doi.org/10.1016/j.prevetmed.2005.02.002. Link
Silva, R.S, M. Q. C. (16 de junio de 2016). Relationships between body condition score and ultrasound skin-associated subcutaneous fat depth in equids. Acta Veterinaria Scandinavica, 58(1): 62. https://doi.org/10.1186/1751-0147-57-S1-P12. Link
Stouffer JR. History of ultrasound in animal science early pioneers in animal science. J Ultrasound Med. 2004; 23: 577–84. Recuperado Link
Superchi P, Vecchi I, Beretti V, Sabbioni A. Relationship among BCS and fat thickness in horses of different breed, gender and age. Ann Res Rev Biol. 2014; 4: 354–65. doi: 10.1186/s13028-016-0243-2
Velásquez-Mosquera JC, M. G. (2 de septiembre de 2016). Asociación de medidas morfométricas con grasa en el anca en caballos de salto en una escuela ecuestre de Bogotá. Rev Med Vet, 32: 67-77 doi: http://dx.doi.org/10.19052/mv.3856. Link
Como citar: Velásquez-Mosquera J. C.; Corrales-Álvarez J. D. Anatomical Distribution of Subcutaneous Fat and its Relationship with Body Condition Score in Pack Mules from the Central Andean Area of Colombia. Revista Veterinaria y Zootecnia. n, v. 13, n. 2, p. 01-13, 2019. http://190.15.17.25/vetzootec/index.php/component/content/article?id=272. DOI: 10.17151/vetzo.2019.13.2.1
Esta obra está bajo una Licencia de Creative Commons Reconocimiento CC BY
|


 | Today | 552 |
 | Yesterday | 555 |
 | This week | 3058 |
 | Last week | 4842 |
 | This month | 13941 |
 | Last month | 15809 |
 | All days | 1358008 |
Online Now: 14
Your IP: 3.133.157.231
MOZILLA 5.0,
Today: November 21, 2024
Your IP: 3.133.157.231
MOZILLA 5.0,
Today: November 21, 2024